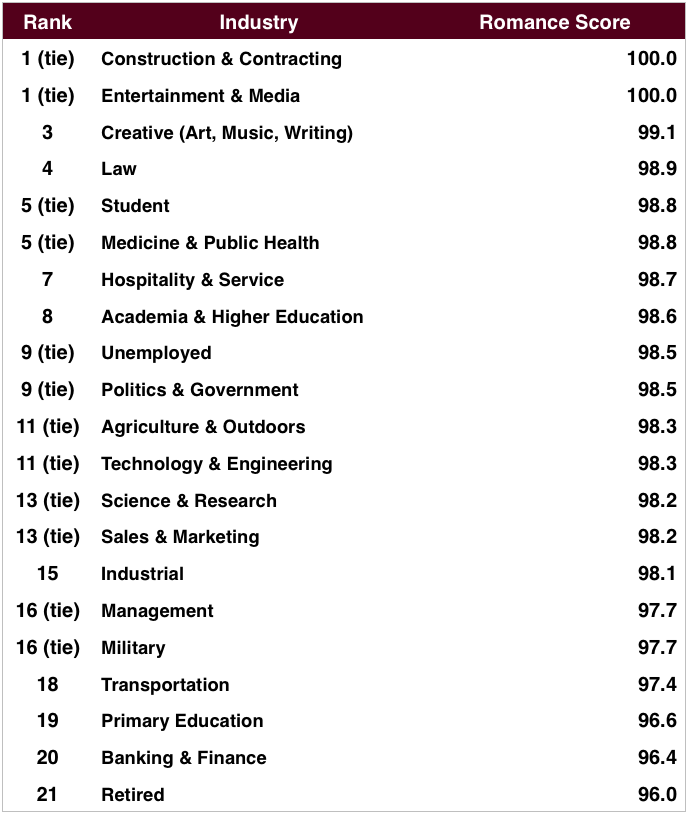
A little over a month ago, I used Nanaya’s database of personalities to figure out which nation had the best lovers. Now that we’re almost at 20,000 users, Nanaya has enough data to see which industries have the best lovers. Below are the composite scores:
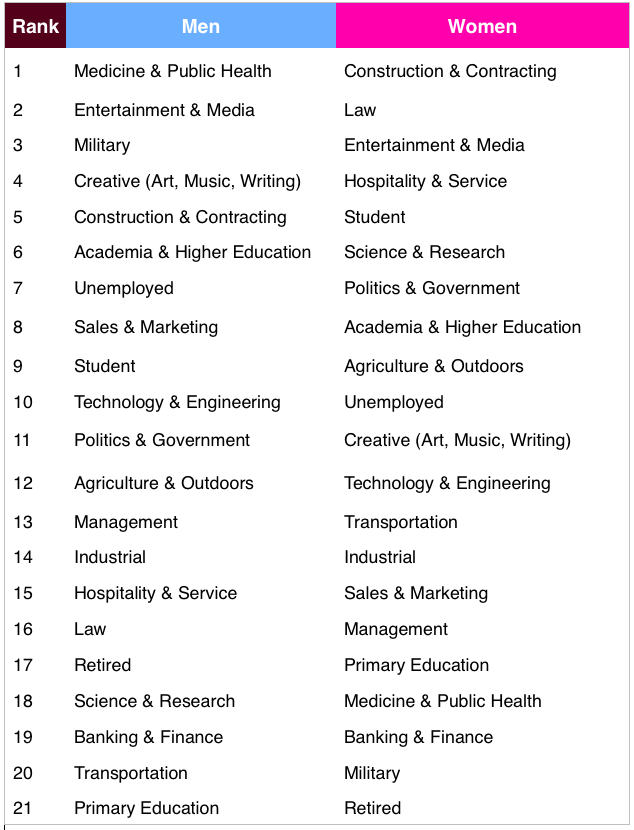
But there are averaged between men and women. Looking at men and women separately, they break down as follows:
Of course, this is just an overview. Drilling deeper into the data we can take away the following conclusions:
- Across industries, the scores are very close but distributions are not identical.
- While genders as a whole are generally identical, men and women in the same industry do have slightly different personalities.
- Based on the previous post, there’s a strong correlation between higher romance score and divorce rate. Data here appears to reinforce that conclusion.
- Gender gap in industry-specific employment shows up in the Nanaya data set.
First a technical clarification between “career” and “industry.” There are many different careers that exist across industries, e.g. a secretary can be employed in just about any of these industries. While the specific career might be the same, the workplace environment and potential dating pool can be drastically different.
What did we actually find out?
No matter what you do, we’re all pretty similar
Jak’s favorite type of chart is the bar and whisker chart. The one below looks at the distribution of romance scores across industries. It’s worthwhile to note how similar they are.
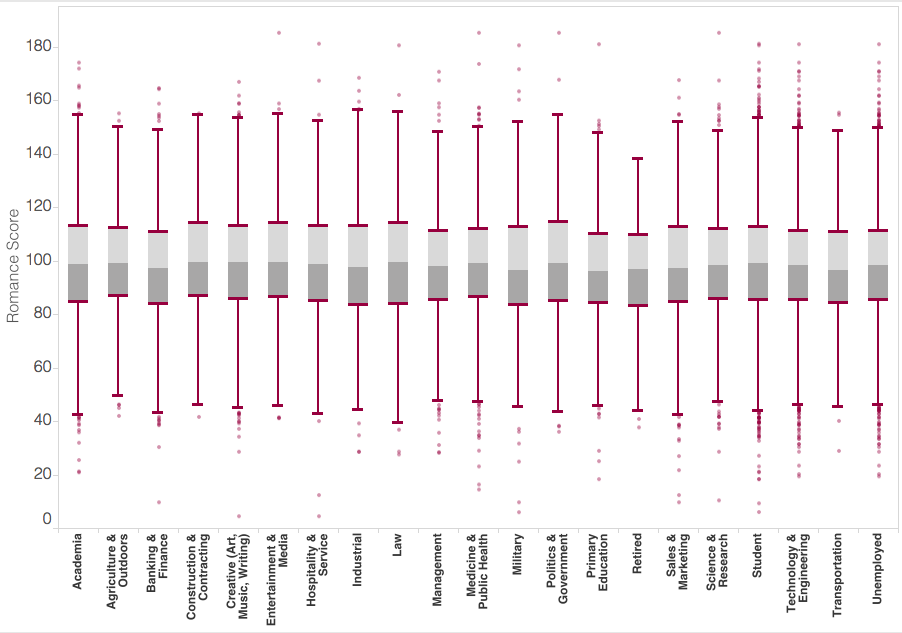
Maybe if we break down personality traits beyond romance, we’d see some larger differences. The ones we do see are pretty sensible:
- The retired are less romantic. Here I stress that we determine romantic as a set of traits that generally indicate spontaneity and willingness to grow. By the time someone retires, they’ve closed most of the chapters of their life.
- Students are the most represented group, at over 5,000 but also have the largest standard deviation. No matter the profession later in life, you probably were a college student so “student” is a bit of a catch-all.
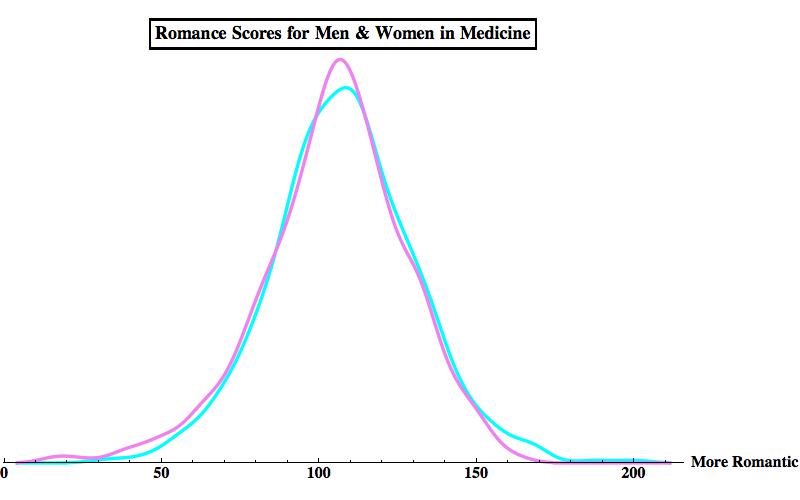
When broken down into gender, the workplace does look different – but only by a little.
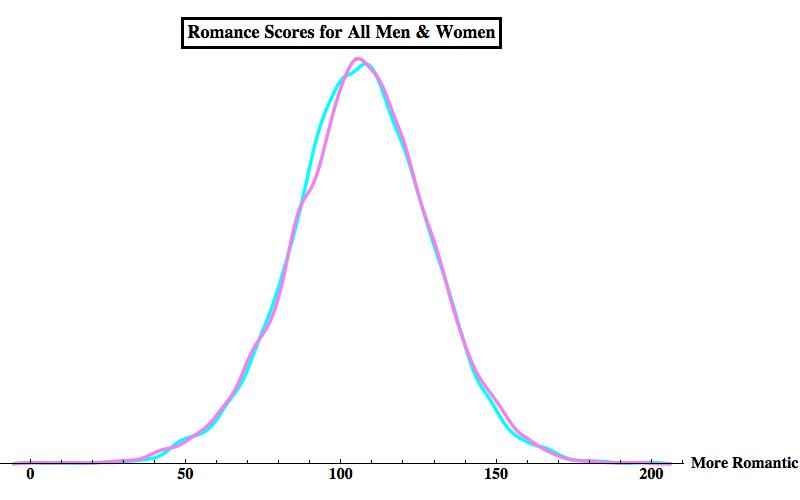
Let’s consider the distribution of all romantic scores for men and women.
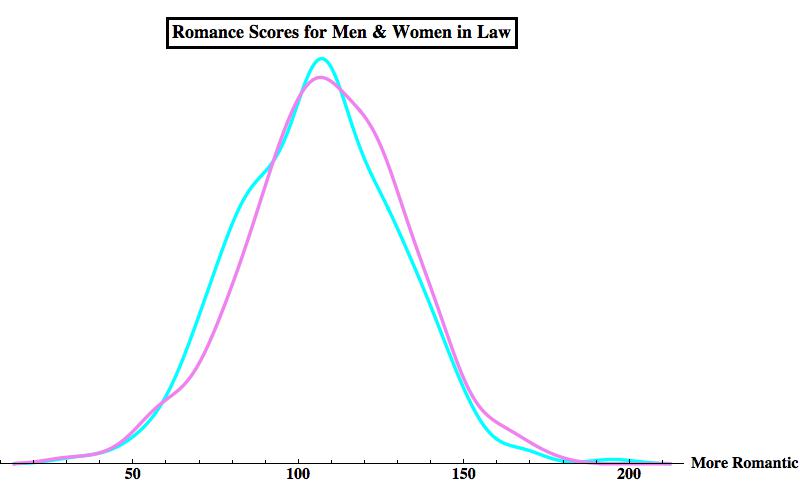
They’re nearly identical. But this does break down a little bit when we look at each career. In fact, for most we see nearly identical peaks but varying behavior at the tails. Interestingly, we see a role–reversal between men and women in law and medicine.
So does this mean that the match made in heaven is a male doctor and female attorney? No. These are aggregate scores and no individual is an aggregate. As much as it seems careers may be similar, the distribution of personalities and the nuances of culture do vary! Maybe more on that another time.
Romance & divorce
A remarkable finding from the post on nations was the relationship between high romance and marriage-to-divorce rate ratio. While we don’t have any real marriage rates for industries, we can look at divorce rates for occupations based on the 2000 US Census.
Topping the high divorce rate list:
- Dancers and Choreographers
- Bartenders
- Massage Therapists
- Gaming Cage Workers
- Extruding and Forming Machine Setters
The jobs with the lowest divorce rates are:
- Agricultural Engineers
- Optometrists
- Military Members
- Clergy
- Transit and Railroad Police
We do see entertainment and creative at the top of both lists while agriculture, military, and transit (sort of) are at the bottom of both! Interesting!
Unfortunately, we have he least amount of data on those in the military, at about 200 people, so it’s hard to say if those values are really indicative. It is interesting that women and men are on the opposite ends of the spectrum, even if it is generally narrow.
Gender gap & employment
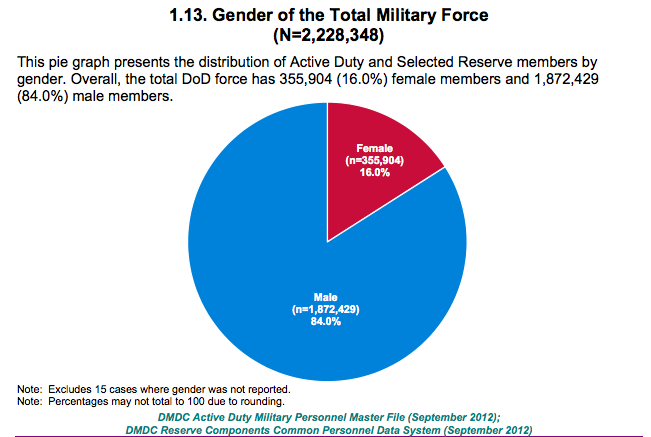
Notably, we had almost an even number of men and women in the military which is surprising given the reality, at least in US and uniformed service.
Being an engineer, I wondered how well Nanaya demographics covered the gender gap seen in America. As of 2012, about 22.2% of engineers in America are women. In the Nanaya database 40% of people in technology & engineering are women.
Both of these anomalously high values make sense given that the majority of people who have taken the Nanaya personality test are not American! As a topical contrast, about 70% of women studying science and engineering in Iran are women.
Ok, so what does this mean for romance?
You might not want to date someone you work with but it’s not uncommon to date people you’ve met through people you work with or through work itself. So when it comes to your romantic odds, where you work and what you do is a major factor.
The data uncovered implies that there are some differences across industries, but they’re not major. What may make even more difference is how you interact with people through work. For instance, a straight woman working in retail sales will have a higher chance of meeting people if she works for a store catering to both genders as opposed to only women. When it’s ready Nanaya will take these into account.
How did we do this?
The same romantic score methodology was used as the post on nations. You can check that out here.
Odds & Ends
There’s an obvious sample bias: respondents were interested enough to take a personality test on Nanaya. This crowd is a bit younger, more male, and more urban.
Most industry data is quite large (~2,000) but the retired and those in the military are below 1,000. Data set was pulled in early April with over 19,000 respondents. People can select up to three “jobs” on the demographic screen to account for careers overlapping industries – this certainly contributes to similarity across industries!
Relationship Scores are synthetic metrics and aren’t a part of a Nanaya algorithm.
Don’t like what you see? The more people take the personality test, the sooner Nanaya will be available.
If you want to complain, send invectives and curses to info@nanaya.co, we’ll still love you.
Bar & whisker chart plotted in Tableau Public & histograms curiously done in Mathematica.

