Well let’s not get too hasty.
Earlier this week, I posted the Nanaya white paper to ArXiv: “Should I Dump My Girlfriend? Will I Find Another?” Or: An Algorithm for the Forecasting of Romantic Options. The title is a bit melodramatic but it’s a reference to Peter Backus’s “Why I Don’t Have a Girlfriend.” Apologies to everyone, especially Dr. Backus.
So this paper summarizes how the Nanaya algorithm works. I genuinely wonder who will have actually read it. Theory papers are hard enough to get through on their own and then harder yet when it’s an interdisciplinary mush. So we’ll go over some of the key points here.
The first major issue is uniqueness. Did we do anything academically worthy? Well, a lot of people have worked on the Secretary Problem (to be covered in a future post), but no one has really tailored it for a situation like romance. There are simplifications that do little justice to the complexity and information available to people – but those aren’t useful. Let’s just call it overzealous journalism…
We also do something new: comparing a specific relationship to being single and the chance of any other relationship. This is options analysis and rather new to the problem.

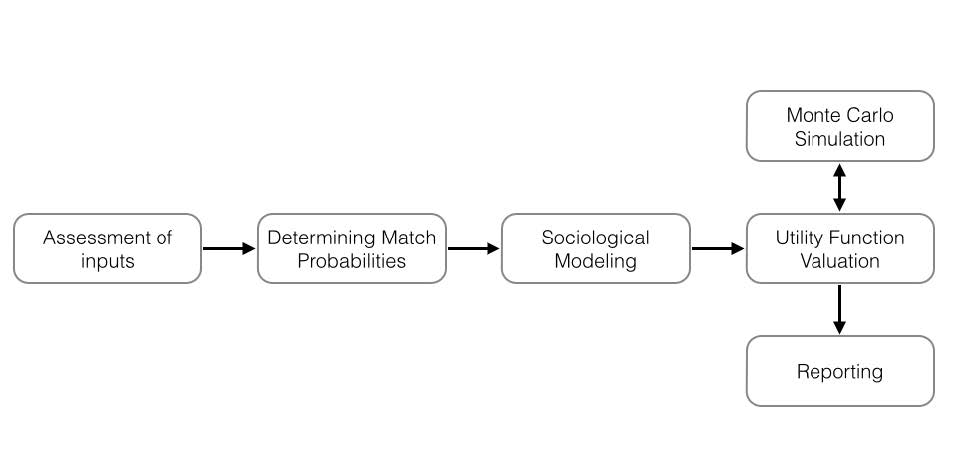
The rest is explaining what’s going on in the algorithm. Let’s check out the first figure:
So let’s break it down by each step:
Assessment of Inputs
When the Nanaya Beta is up (pending funding, be sure to call your local, friendly Venture Capital fund and request them to fund Nanaya) we’ll be asking a bunch of questions to understand your life circumstances:
- What is your personality and social and romantic history. This gives us an idea of how likely you’ll be successful in finding a match, attracting a match, and how happy you are when you don’t have a partner in your life. We also need to know how long you’ve been in the city and job you’re in as that has a huge impact on how many people you’ll be meeting. You can check out this blog post that goes over this detail.
- What is the ideal This is a mix of personality and specific values that are shared.
- If you’re with someone, how do you feel about them.
- The groups you interact with, like at work, geographically, and in socializing.
Determining Match Probabilities
With all of that data we can use our database and others available to us to figure out what the chance is of finding a match in any given encounter, depending on the group.
These numbers are typically low. Something like 1-in-10,000 is not unreasonable. This is where statistics comes in to play and you have something like the birthday paradox to offset those low odds.
Sociological Modeling
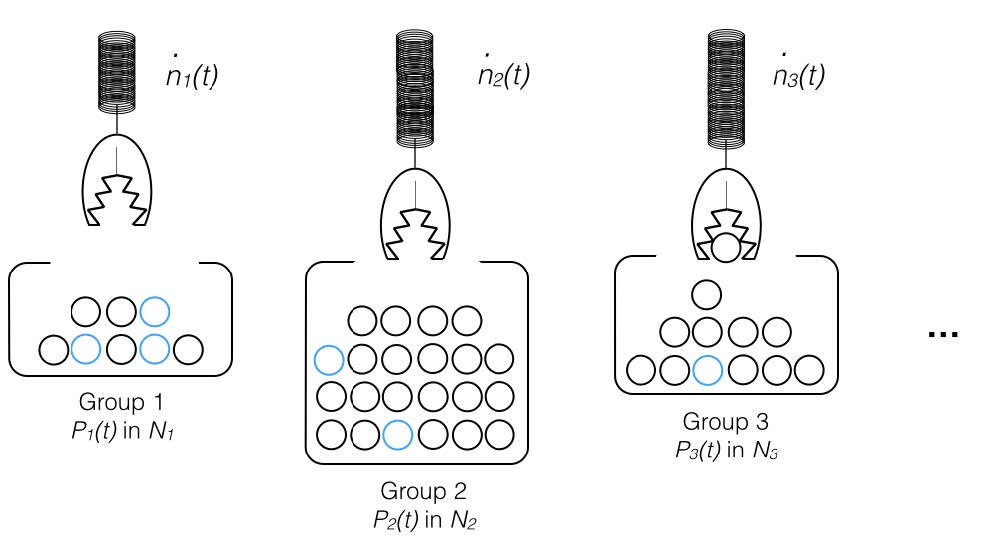
This is where we mix the match probabilities with your social behavior to figure out what are the chances of actually meeting someone. This is a bit of sociology and a bit of statistics to solve a problem no one’s really touched before, at least in this context (if I’m wrong, let us know). The sociology is based on personality, group types, and the results of some of our prototype experiments. The probability is based on binomial distributions and a variation of the Urn Problem. This is how we describe our social interactions…with urns!

We admit we make some simplifications in the paper, namely use of binomial probability distributions and assumptions that populations are very large. For almost everyone, these are pretty good assumptions but not for people in small populations. This gets into a lot of theoretical combinatorics which is well understood but not yet implemented.
Utility Function Valuation
This is the ugly philosophically ugly part where we literally put values to things that ordinarily don’t have numbers associated with them: like compatibility and happiness.
Using personality test results for who you are, who you want, and who your partner is we can estimate how happy you’ll be in any given relationship. We can also use your personality and romantic history to gauge how happy you’ll be in time as you’re single.
To simulate a random match you meet through the course of your life, we run a Monte Carlo simulation based on the groups you interact with. Some groups will have their own types of traits that lead to specific archetypes or segments (in demographic-speak) – we want to respect what’s observed in reality so we use these archetypes in seeding the randomness of the Monte Carlo.
Reporting the Results
With all of the above done, all that’s left is showing the numbers in a way that’s easy to digest!
If you sign up and take our personality tests, we’ll be inviting you to join our Beta program when it’s ready! So be sure to take your personality test and start today!
